Life as a GitHub Intern: What laser cutting taught me about contribution graphs
This post follows the story of a GitHub intern’s experience laser cutting a contribution graph to creating an application that automates the process.

Anisha Gupta is a recent graduate from Arizona State University, a Campus Expert, and developer workshop leader at events around the world. She joined the GitHub Developer Marketing team in January as a Developer Relations Intern and will be working through Summer 2018. In this post, Anisha shares how she was able to connect with diverse communities and find inspiration, while working remotely from ASU, by laser cutting contribution graphs.
Students don’t realize how much stuff they get for free—I didn’t until I was three months away from graduation. I’d just started an internship on GitHub’s Developer Relations team when I also discovered my university’s laser cutting lab. I passed by the lab daily but never entered because I didn’t even know what laser cutting was. It didn’t occur to me to try it out until I found the perfect design idea: contribution graphs. My contribution graph tells me what I’ve contributed to, how I contributed, and how often I worked on projects.
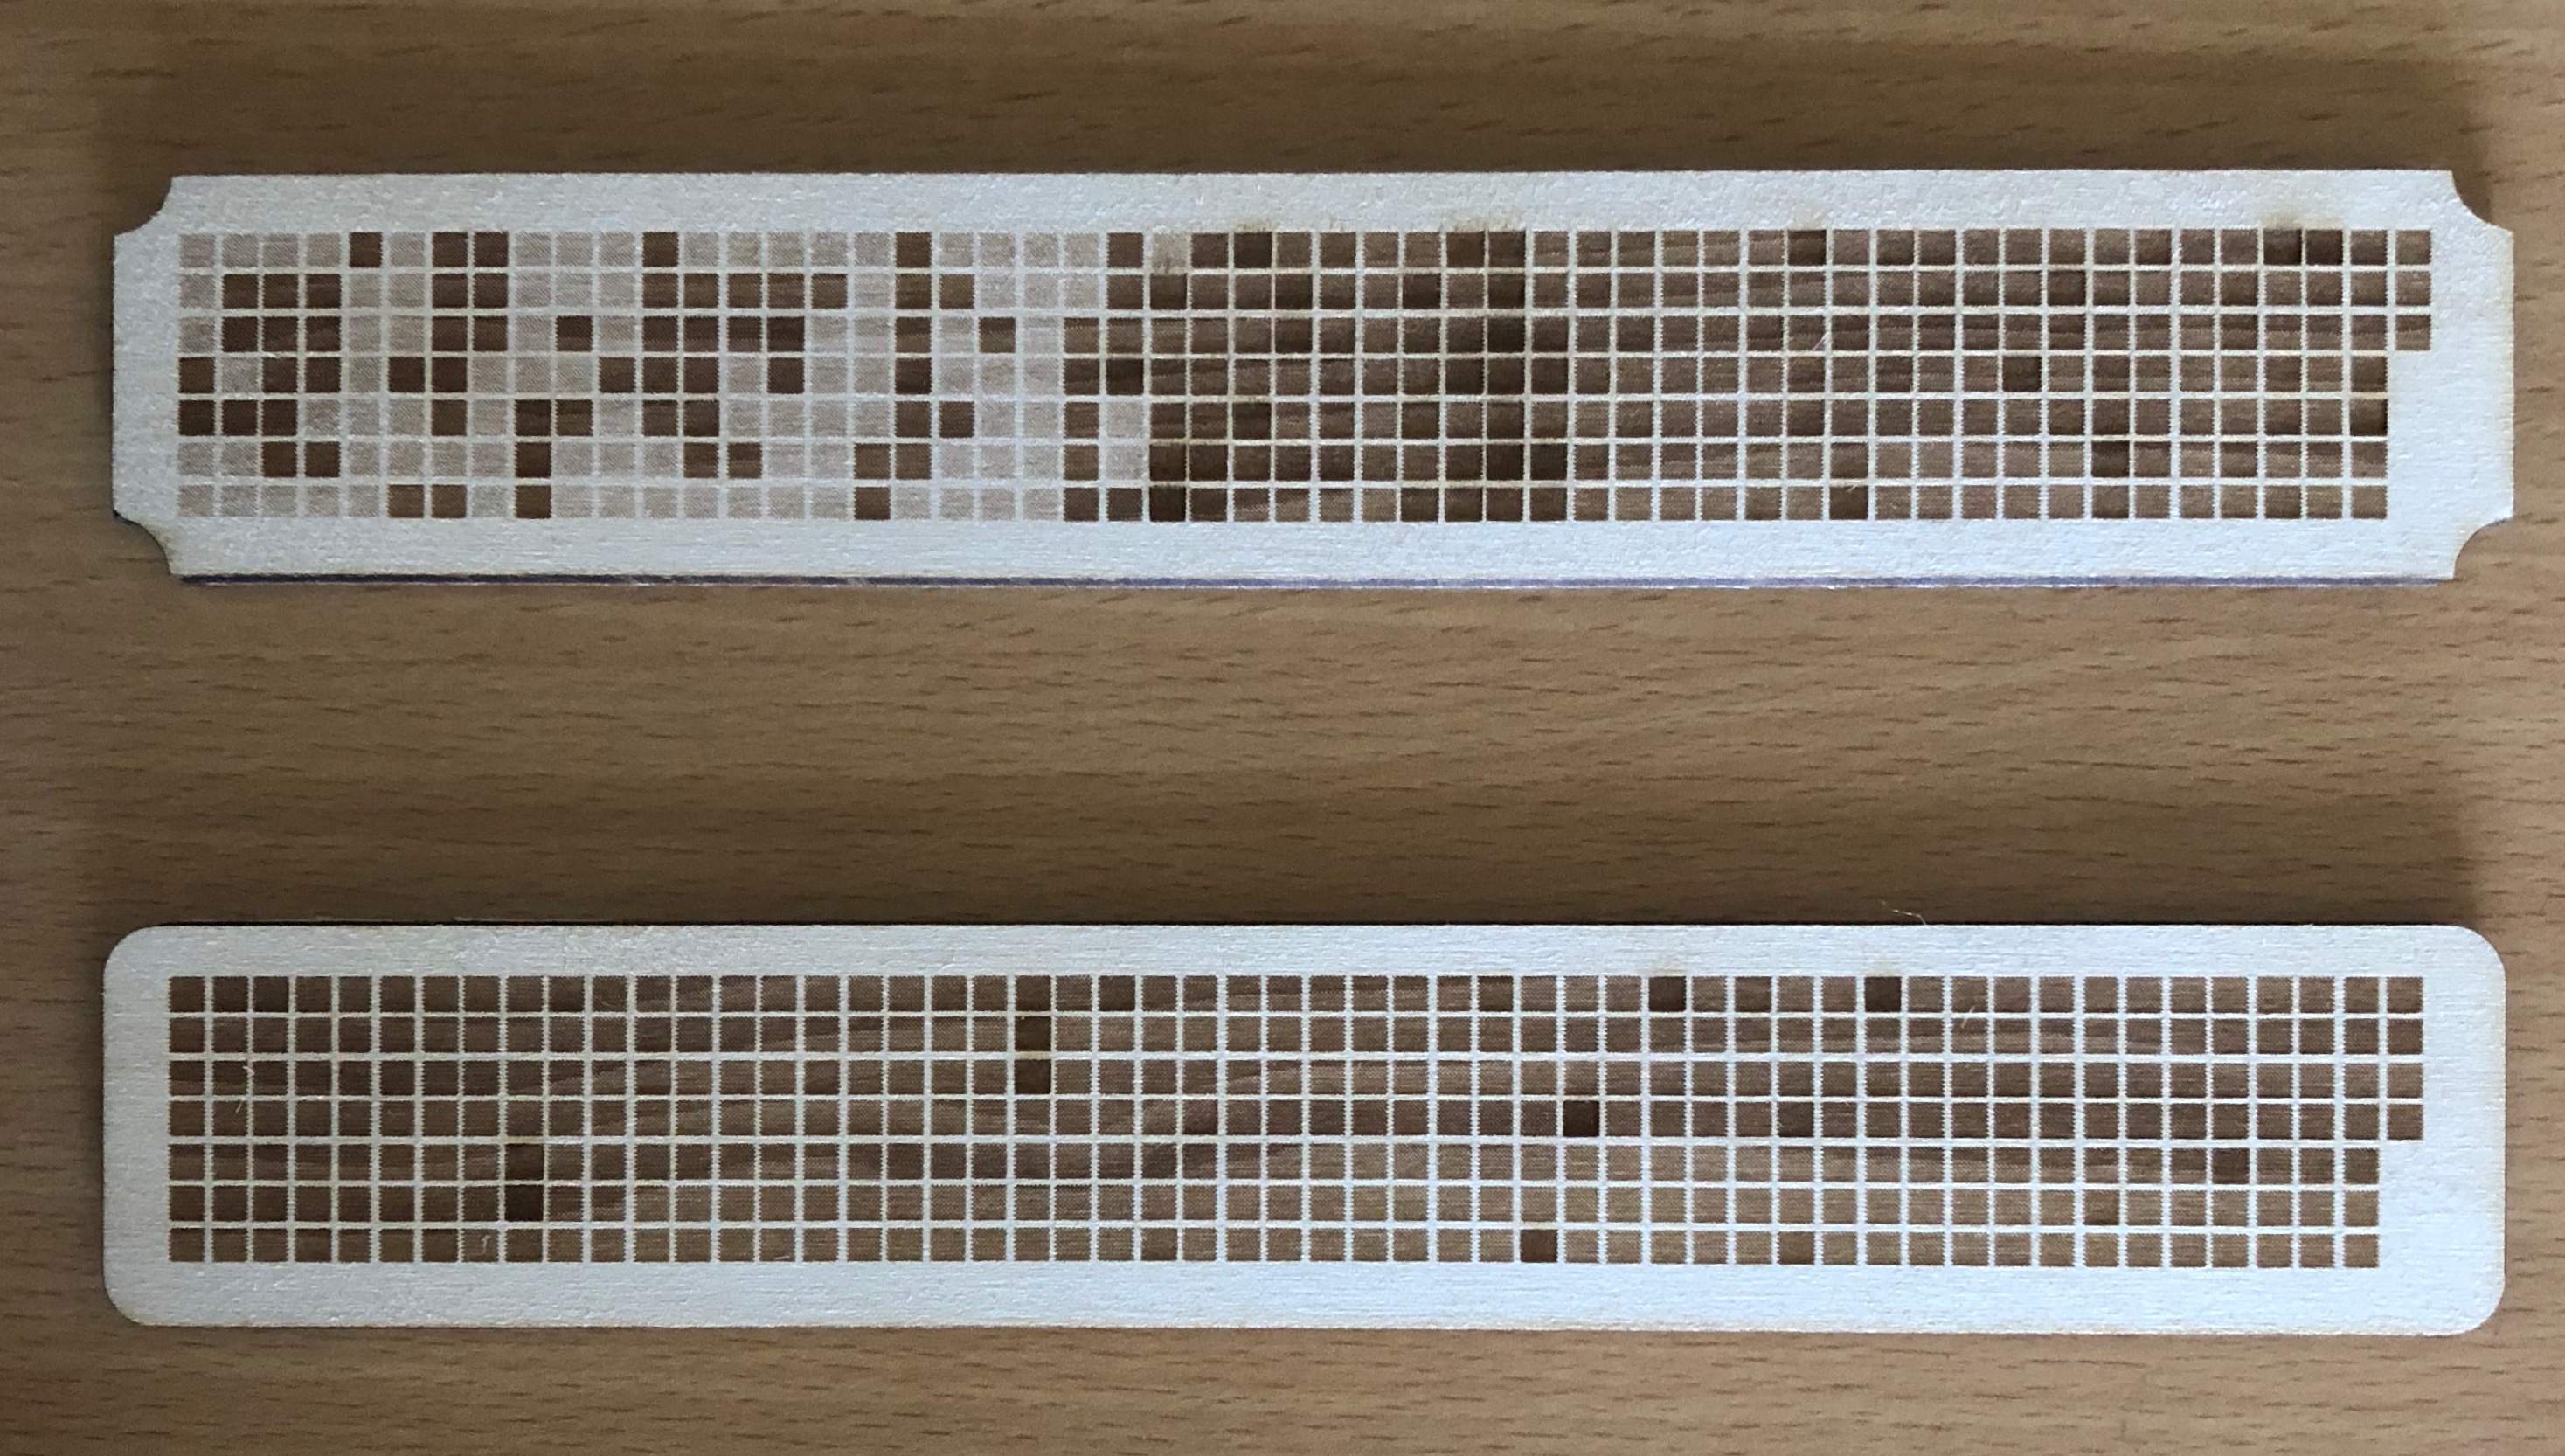
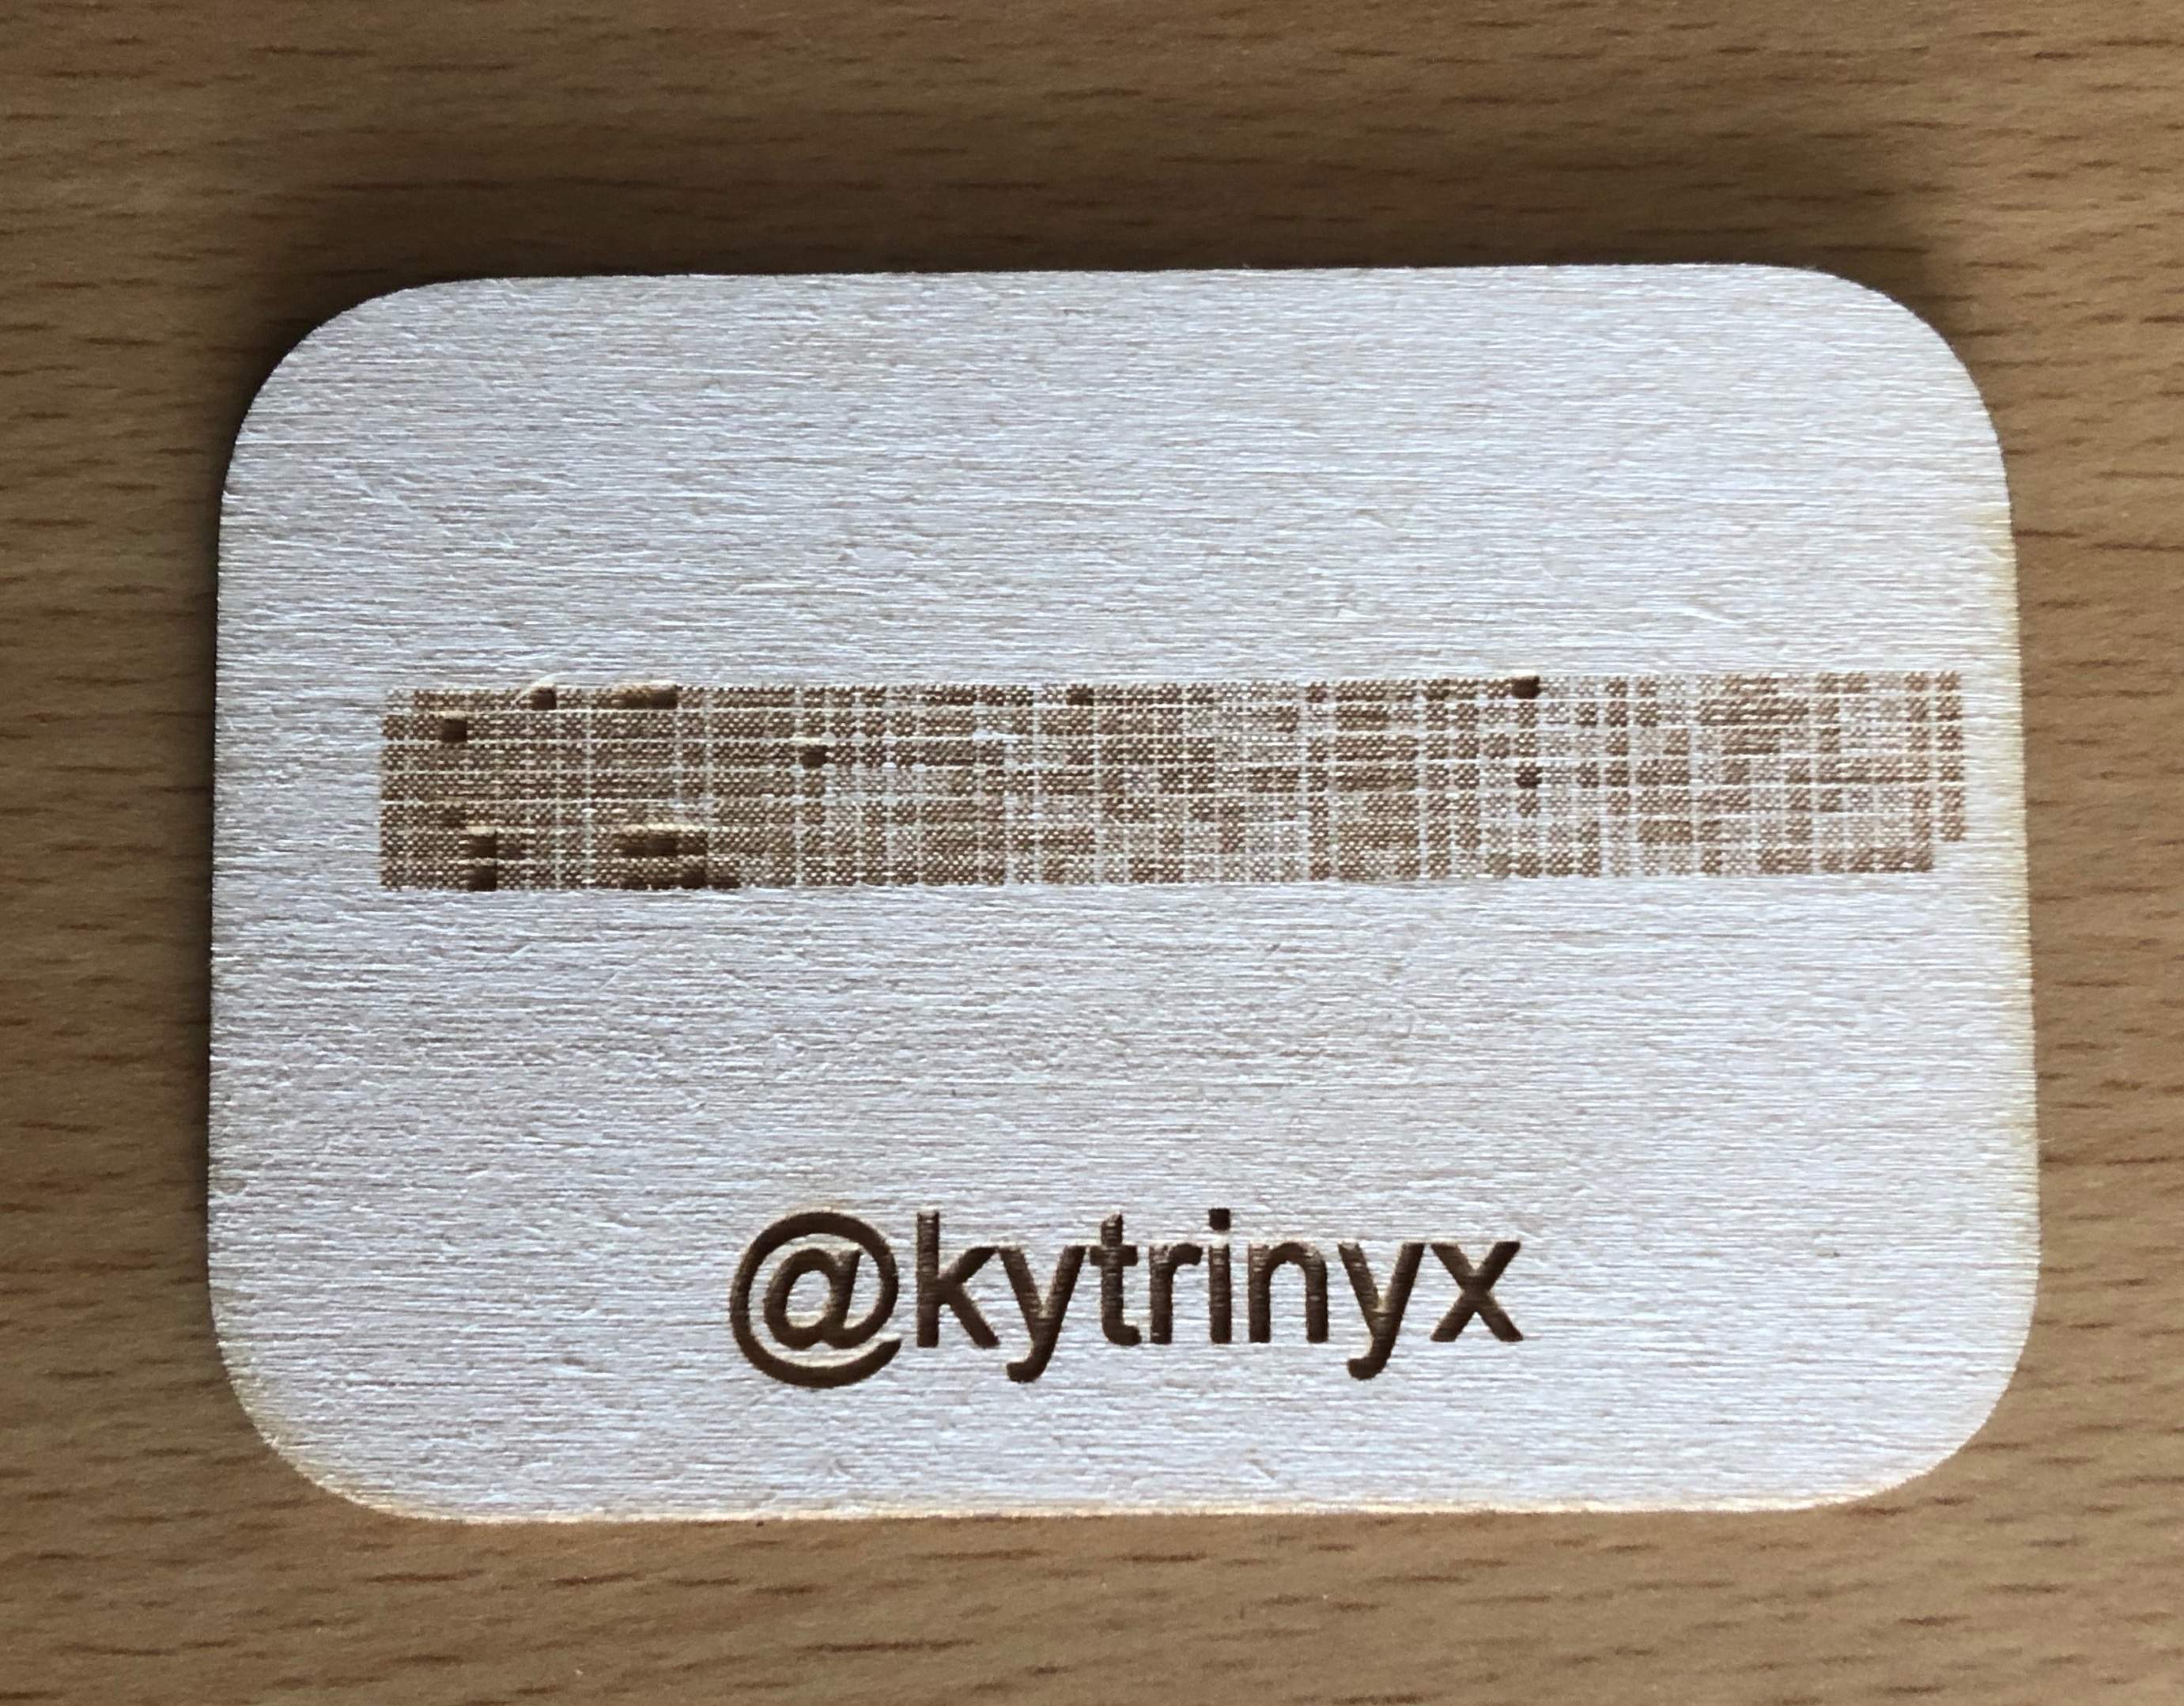
After talking to a mentor from the GitHub Team, Katrina Owen, I learned that she works daily on her open source project, exercism.io, and it takes 100 commits to turn a gray square green on her contribution graph. This was humbling and inspiring to hear as a recent graduate just about to enter the developer industry. That’s when I decided to laser cut @kytrinyx’s contribution graphs from 2013 and 2014 to remind myself of the effort one has to take to reach their goals. What started as something cool to have on my desk is now my source of inspiration as I look ahead to building my skills as a developer.
Getting started with laser cutting
I worked with my school’s lab manager to outline the steps for the laser-cut contribution graph I wanted to create. These are the steps I followed:
- Take a screenshot of the contribution graph you want to laser cut
- Use software that’s connected with your laser cutter (in this case, CorelDraw)
- Import the screenshot and convert it to a grayscale image
- Adjust the laser cutter’s settings to fit the wood density and thickness
- Click print
Once I started laser cutting more contribution graphs, including one I gave to Katrina, I set out to work on a project which allowed all GitHub users to create laser-cut contribution graphs. I consulted Ladies Storm Hackathons (LSH), a Facebook group that empowers women to collaborate and go to hackathons together. I got an overwhelming response from members who were excited to be part of the project.
But now I had to screenshot 20 different contribution graphs, adjust their sizes, and put them into one SVG file. My team suggested that I create an application to automate the process, so I set out to build an app that would let me create laser-cut contribution graphs and then place an order for business cards.
Building the application
A first attempt
I started out by reaching out to the GitHub Ecosystem team, and Katrina suggested I look at Puppeteer, a headless Chrome tool that renders and screenshots pages without having to pull up the browser itself. I found a Puppeteer sample on Glitch, which I used as the basis of my application. I dove into testing different methods within Puppeteer and was able to grab screenshots of contribution graphs from GitHub usernames. The few lines of code below show the two core methods that powered the application. It navigated to my profile page and took a screenshot based on the clip parameters I specified:
await page.goto('https://github.com/ani6gup');
await page.screenshot({path: __dirname+'/public/puppeteer.png', clip: {x: 320, y:630, width:660, height:100}});
However, the clip parameters were too specific. Each user’s contribution graph is placed at a different pixel based on a user’s descriptions and pinned repositories. In short, the application only worked perfectly with my profile.
Refining the app
I pair programmed with John Crepezzi, who introduced me to Ruby and various gems and packages such as Nokogiri, a parser of many file types, and Octokit.rb, a simple way to connect with the GitHub API. Nokogiri parsed the profile page into one HTML file that’s used to grab and filter the GitHub contribution graph into its own variable (and later converts it to an SVG file):
doc = Nokogiri::HTML.parse(contents)
doc.css('.js-calendar-graph-svg > g').first['transform'] = nil
graph = doc.css(".js-calendar-graph-svg").first
For the front and back side of the business cards, the app provides SVG templates and information from the GitHub profile page are used to fill in the name and handle. Octokit collects the profile information based on the username, and it only requires one line to connect to the API: user = Octokit.user(login). The end product is an application which requires only a username to create three SVG files and place them into a folder.
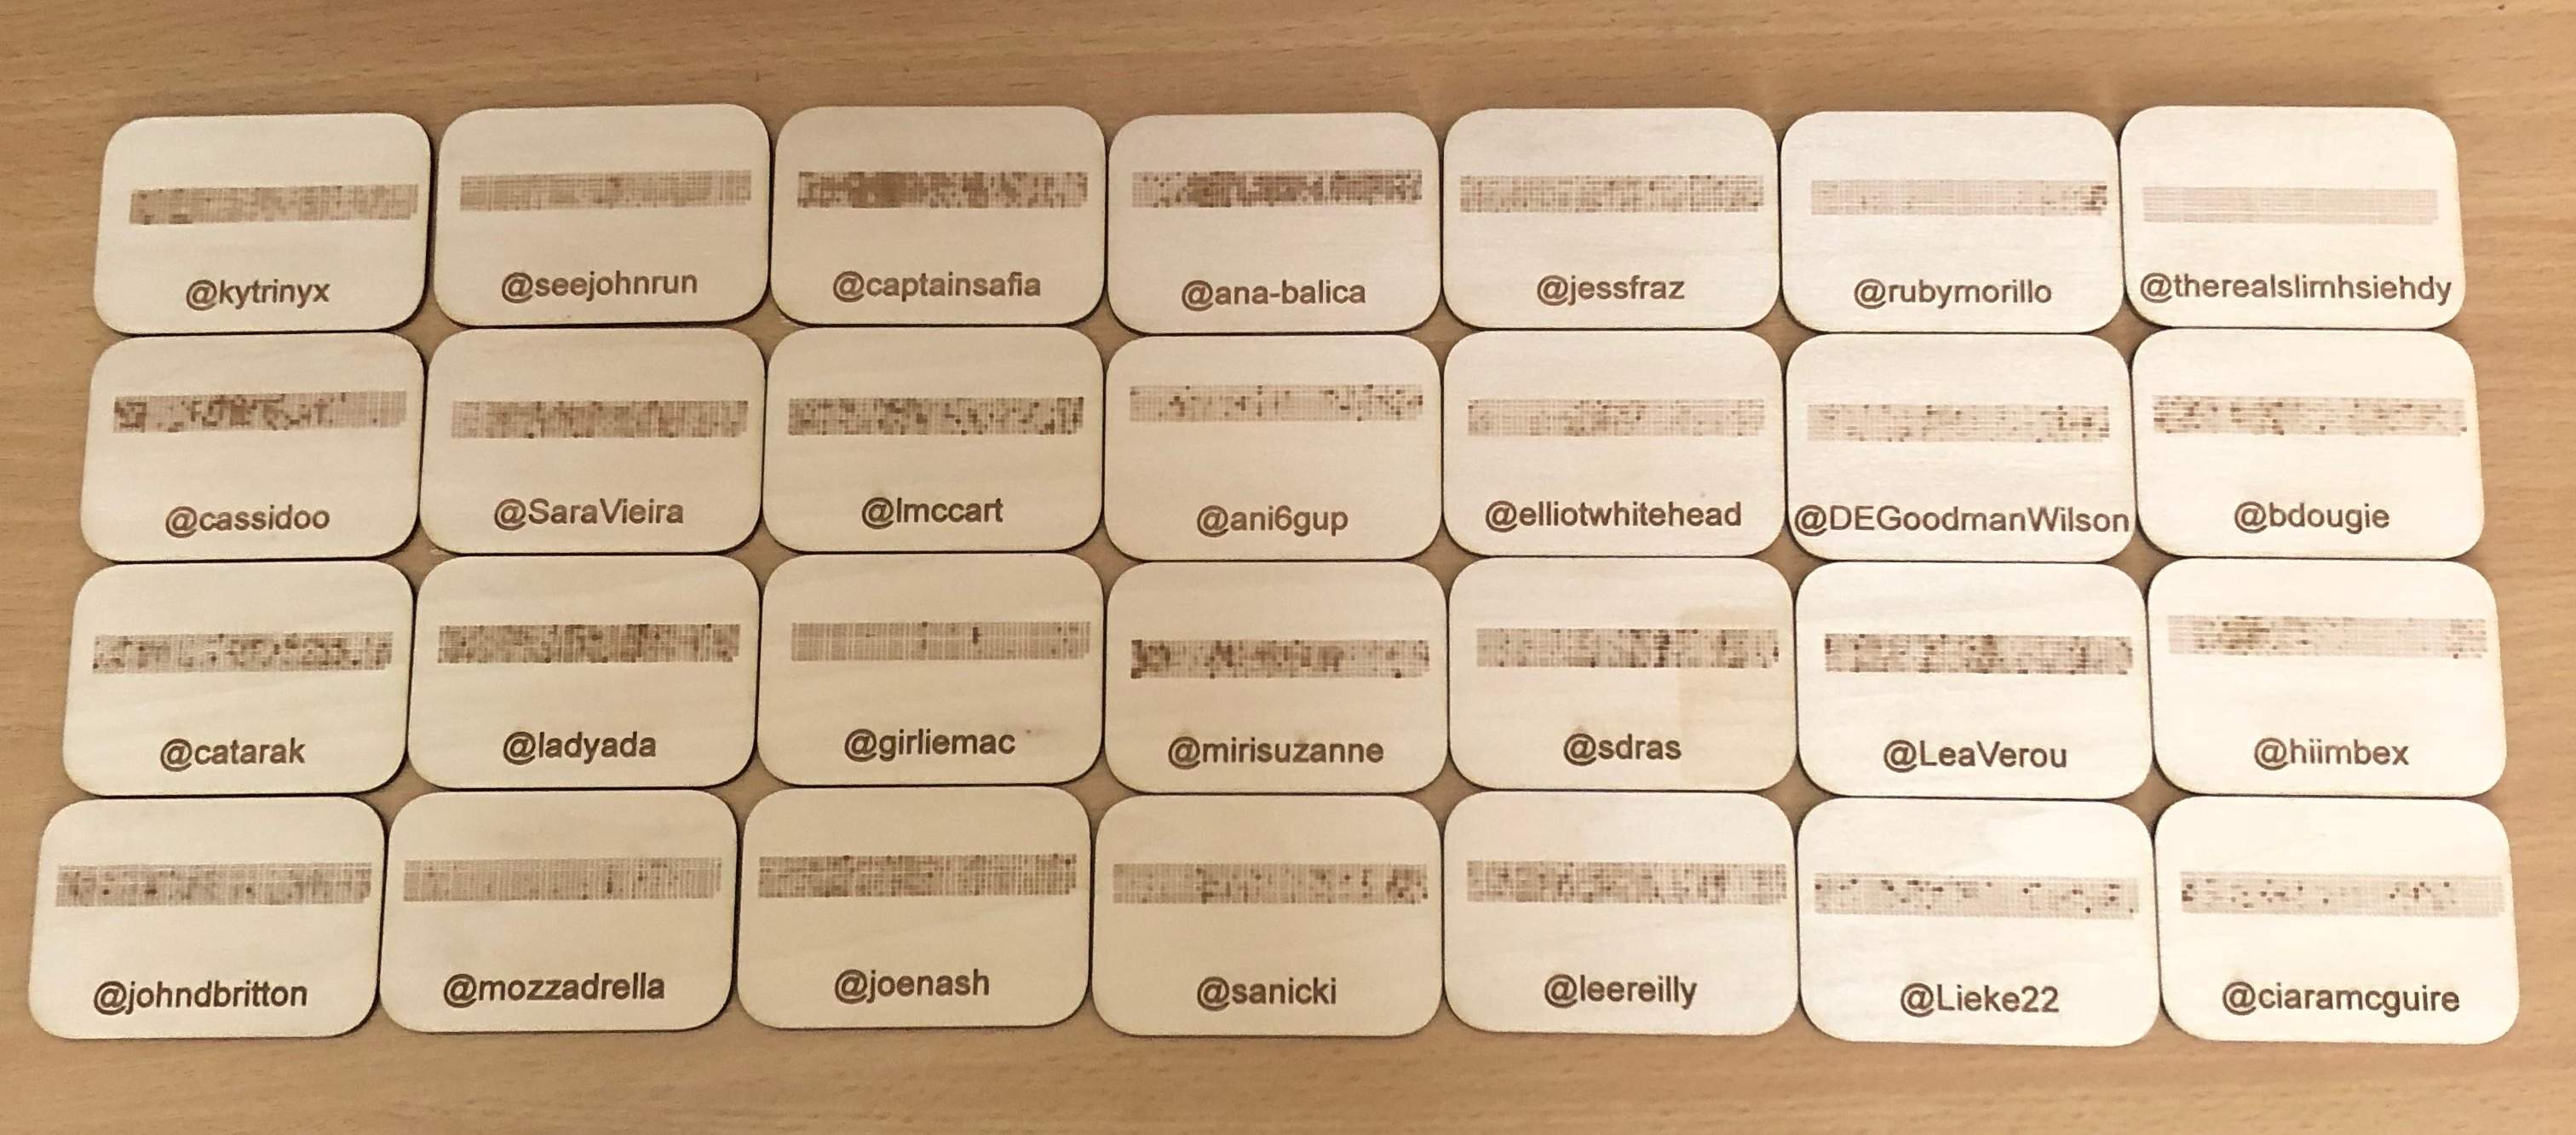
By automating this process, I was able to print out 28 business cards at one time. The 28 in the photo below are a combination of people who have helped me, community members from LSH, and my GitHub Team.
How I feel about contribution graphs now
This project showed me how communities can come together to expand on an individual’s idea to create something larger. Working with contribution graphs helped me find common ground with other GitHub community members. I learned about the projects they worked on and how they came to release, maintain, and make their projects thrive on GitHub. In the past, I was intimidated by profiles with green-filled graphs, but I realized that each person has their own story to tell, no matter what their graph looks like. And there are always opportunities to contribute more.
If you’re interested in expanding the projects you contribute to on GitHub and seeing more of those green squares, here are some resources that have helped me:
- Try GitHub Learning Lab if you’re new to GitHub
- Contribute to an open source project (it doesn’t have to be only code)
- Learn more about contributing to open source
- View or suggest edits to the GitHub Open Source Collection
- Participate in an open source themed event like (Hacktoberfest, 24 Pull Requests, or Rails Summer of Code
- Create a website in less than five minutes with GitHub Pages
- Journal every day in a private repo
If you would like laser cut your own business card or any design you had in mind, find a local makerspace to build things and become a part of a maker community.
Written by

Related posts
GitHub Availability Report: March 2025
In March, we experienced one incident that resulted in degraded performance across GitHub services.

Vibe coding with GitHub Copilot: Agent mode and MCP support rolling out to all VS Code users
In celebration of MSFT’s 50th anniversary, we’re rolling out Agent Mode with MCP support to all VS Code users. We are also announcing the new GitHub Copilot Pro+ plan w/ premium requests, the general availability of models from Anthropic, Google, and OpenAI, next edit suggestions for code completions & the Copilot code review agent.

GitHub Availability Report: February 2025
In February, we experienced two incidents that resulted in degraded performance across GitHub services.